









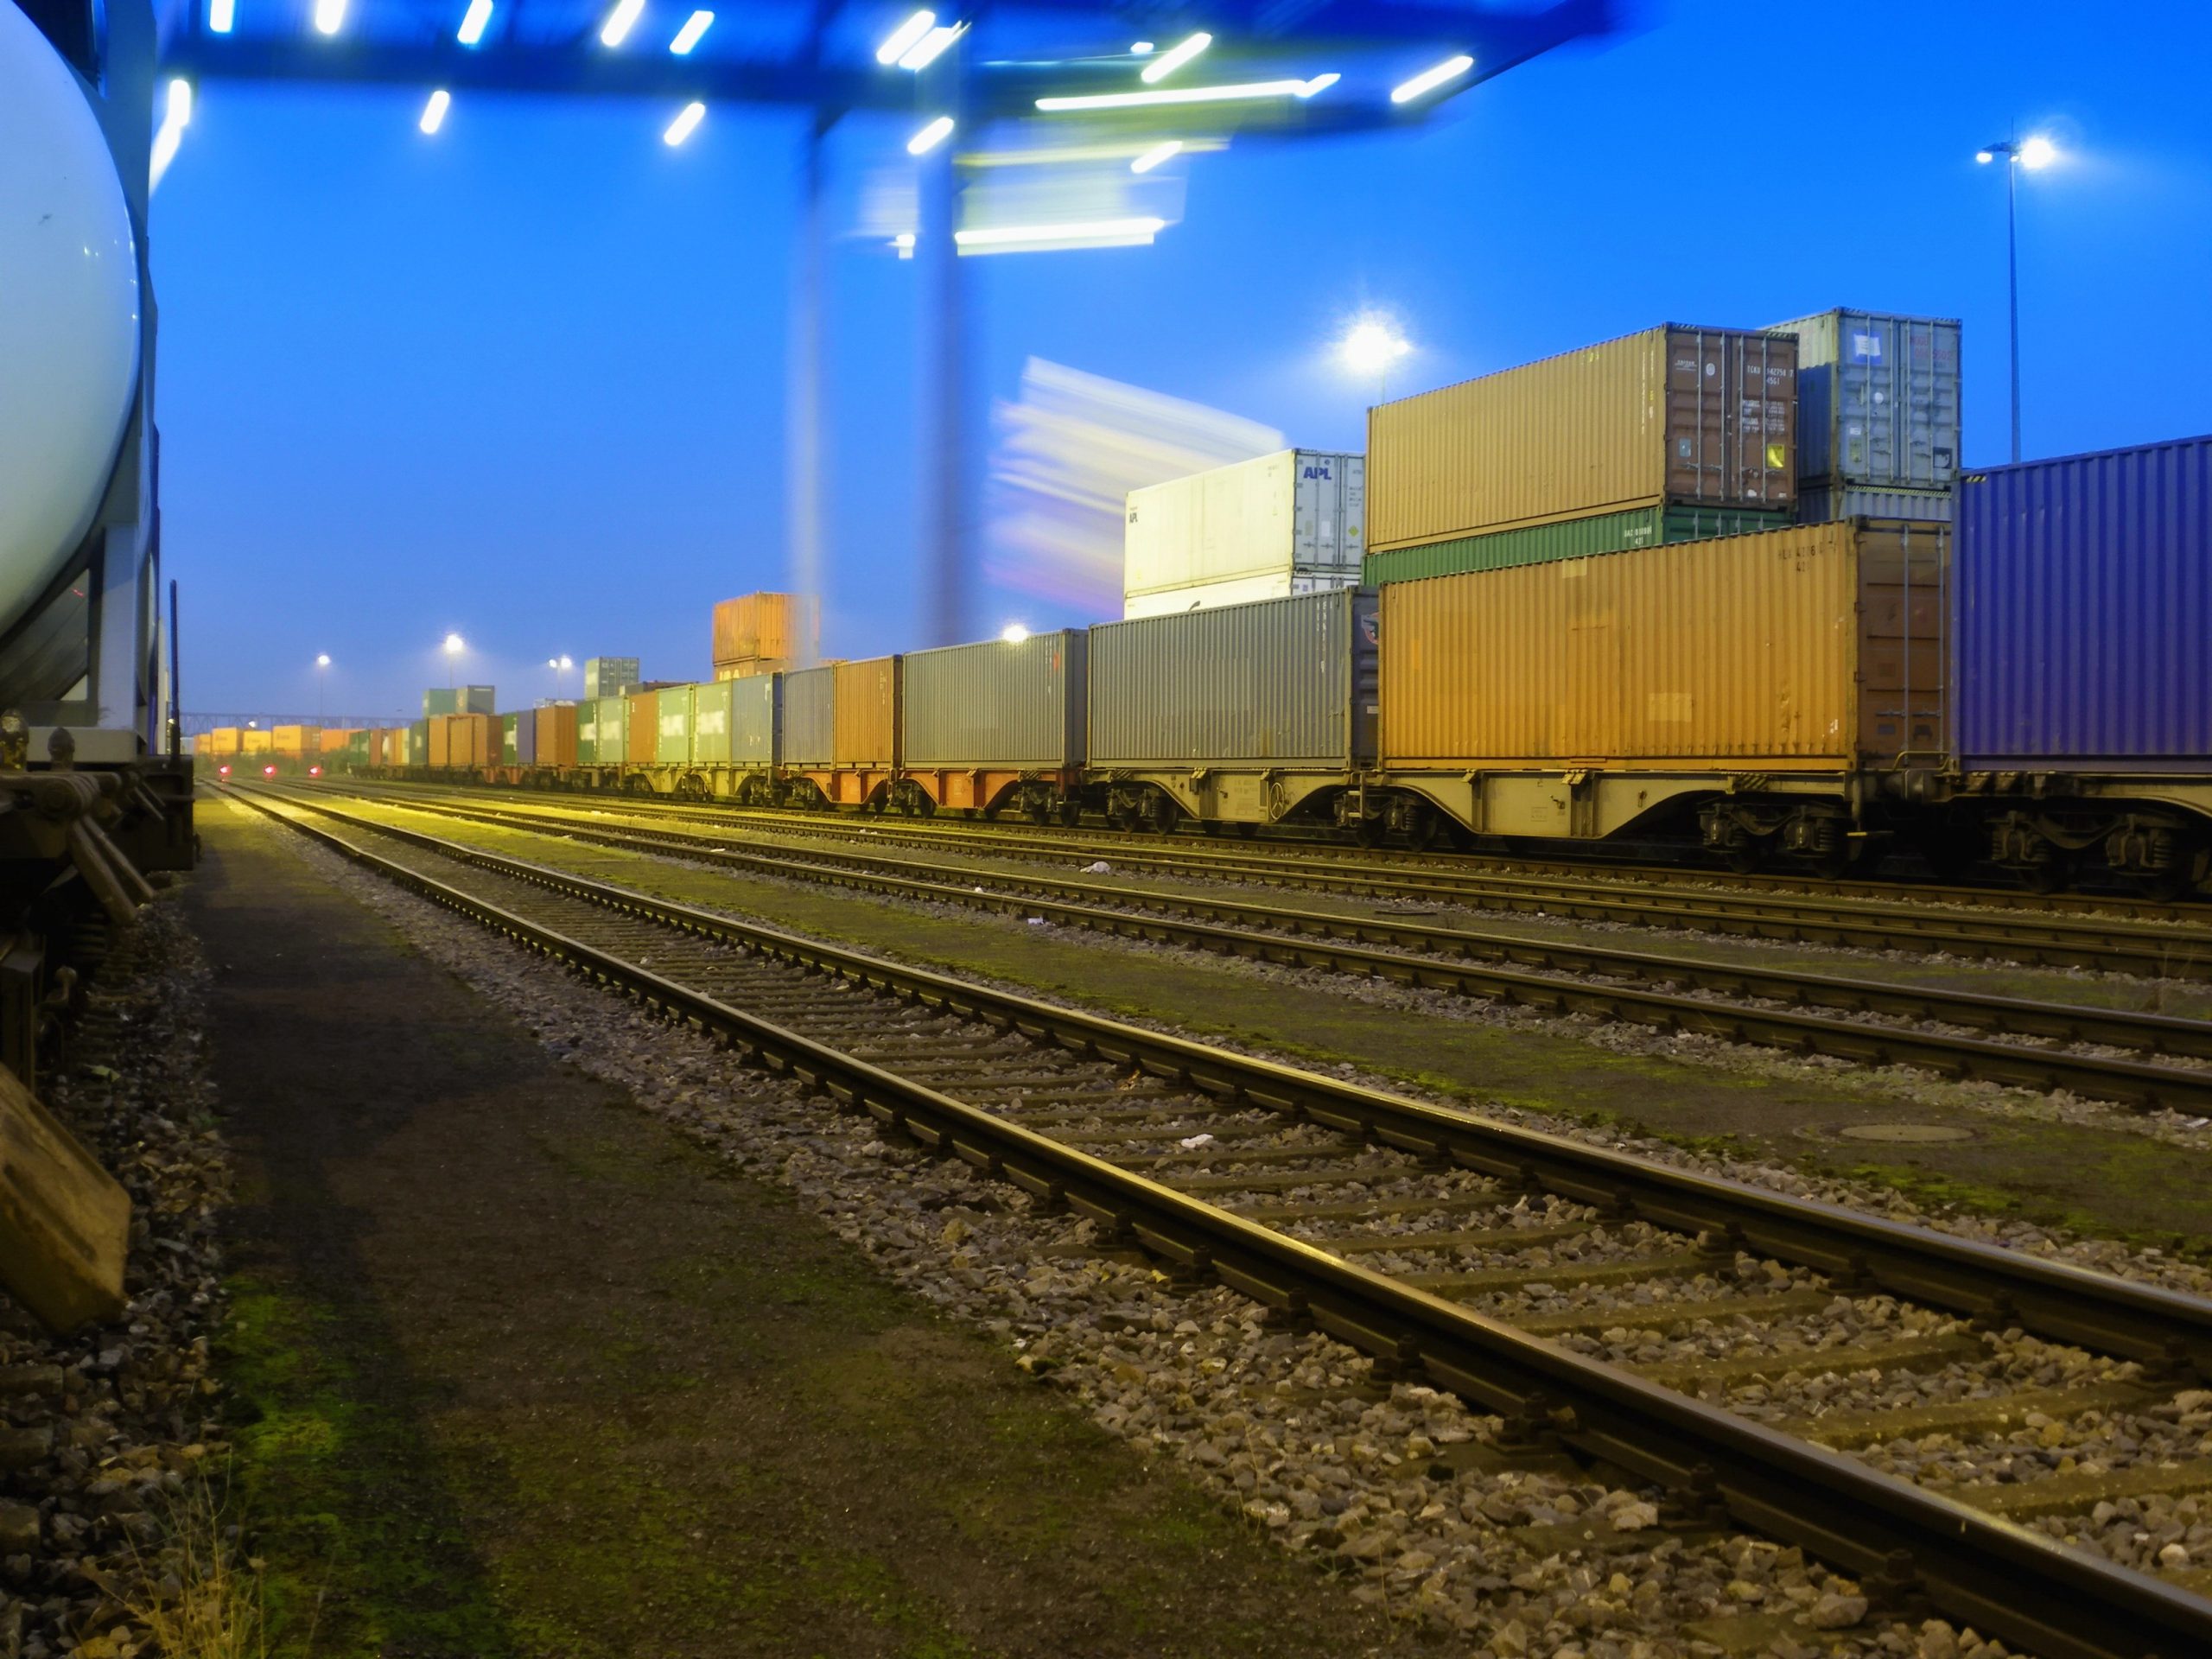
In the second quarter of 2026, the mass of goods transported by rail increased by 5.6% compared to the same period in 2025. The result was primarily influenced by higher volumes of energy raw material transport.
In the second quarter of 2026, over 55.7 million tonnes of cargo were transported by rail, which is 5.6% more than in the corresponding period of 2025. Transport performance reached almost 14.9 billion tonne-kilometres, representing an increase of 8.9% compared to the second quarter of 2025.
The average transport distance per tonne of cargo exceeded 267 km, compared to 259 km in the second quarter of 2025.
Data for the second quarter of 2026 show that the structure of freight transport remains stable. Energy raw materials and mining and quarrying products continue to dominate, forming the foundation of bulk rail transport. Their high share reflects the role of rail as an efficient means of transporting large volumes of cargo. The share of unidentifiable goods is steadily increasing, which indicates that the position of intermodal transport is strengthening. The dynamic growth in the transport of agricultural products confirms rail’s ability to serve both traditional sectors of the economy and segments that are developing dynamically in response to changing market needs.
– comments Dr. Eng. Ignacy Góra, President of the Office of Rail Transport
Transport of commodity groups after the first half of 2026
In total, over 107.2 million tonnes of cargo were transported by rail in the first half of 2026, which is almost 2.3 million tonnes more than a year earlier (+2.2%). Transport performance reached almost 28.3 billion tonne-kilometres, representing an increase of 4.8% compared to the same period in 2025 (27 billion tonne-kilometres). Market growth was primarily the result of higher transport volumes of energy raw materials and unidentifiable goods related to intermodal transport. Together, these two groups accounted for over 4 million tonnes of additional transport compared to the first half of 2025.
The largest increase in transported mass was recorded in the group of hard coal, lignite, crude oil, and natural gas, where the volume increased by almost 1.8 million tonnes (from 30.4 million tonnes to 32.2 million tonnes), and the share of this group rose to almost 30% of the market compared to 28.9% a year earlier. This is also the largest share in the total mass of goods transported.
A slightly smaller increase occurred in the group of unidentifiable goods, mainly including intermodal units, for which the transport mass increased by over 1.7 million tonnes, to over 12.4 million tonnes. The share of this group rose from 10.2% to 11.6%. This growth confirms the continuing trend of intermodal transport development and its importance in the structure of rail freight transport.
The largest decline was recorded in the group of metal ores and other mining and quarrying products. In the first half of 2026, over 25.4 million tonnes of these goods were transported compared to almost 29 million tonnes a year earlier, representing a decrease of 3.6 million tonnes (-12.3%). The share of this group decreased from 27.6% to 23.7%. However, this decline was more than offset by the increase in the transport of energy raw materials and intermodal transport, thanks to which the freight transport market recorded a year-on-year increase.
The share of the group of coke, briquettes, and refined petroleum products increased slightly – from 13.5% to 13.9%.
In the first half of 2026, the transport of metal ores and mining and quarrying products continued to have the largest share in transport performance (23.7%), although its importance decreased compared to the first half of 2025 (28.3%). At the same time, the share of the group of coke, briquettes, and refined petroleum products (from 19.9% to 20.5%) and metals and metal products (from 4.7% to 5.3%) increased in transport performance. The share of hard coal, lignite, crude oil, and natural gas transport remained stable at 17.5%.
Structure of transport in the second quarter of 2026
Despite changes in individual commodity groups, the structure of transport in the second quarter of 2026 did not change significantly compared to the first quarter of 2026. Transport of energy raw materials, mining and quarrying products, and refined petroleum products continued to dominate, accounting for approximately 67% of the total cargo mass transported. At the same time, the share of unidentifiable goods continues to grow, which is associated with the development of intermodal transport.
Commodity groups with the largest share in transported mass in the second quarter of 2026:
- hard coal, lignite, crude oil, and natural gas – 27.4% (almost 15.3 million tonnes),
- metal ores and mining products – 26.7% (almost 14.9 million tonnes),
- coke and refined petroleum products – 12.9% (over 7.2 million tonnes),
- unidentifiable goods – 11.7% (over 6.5 million tonnes),
- metals and metal products – 4.4% (almost 2.5 million tonnes),
- chemicals and chemical products – 4.4% (over 2.4 million tonnes),
- products of agriculture, hunting, forestry, and fishing – 2.6% (almost 1.5 million tonnes),
- products from other non-metallic raw materials – 2.3% (almost 1.3 million tonnes),
- food products, beverages, and tobacco products – 1.8% (almost 1 million tonnes),
- secondary raw materials, municipal waste – 1.6% (almost 0.9 million tonnes).
Commodity groups with the largest share in transport performance in the second quarter of 2026:
- metal ores and other mining and quarrying products – 26.8% (almost 4 billion tonne-kilometres),
- coke, briquettes, refined petroleum products, gases produced by industrial methods – 19.2% (almost 2.9 billion tonne-kilometres),
- hard coal, lignite, crude oil, and natural gas – 15.5% (over 2.3 billion tonne-kilometres),
- unidentifiable goods – 14.8% (over 2.2 billion tonne-kilometres),
- chemicals, chemical products, synthetic fibres, rubber and plastic products, nuclear fuel – 5.5% (over 0.8 billion tonne-kilometres),
- metals, finished metal products (excluding machinery and equipment) – 4.6% (almost 0.7 billion tonne-kilometres),
- products of agriculture, hunting, forestry, and fishing – 3.6% (over 0.5 billion tonne-kilometres),
- products from other non-metallic raw materials – 2.3% (over 0.3 billion tonne-kilometres),
- food products, beverages, and tobacco products – 1.7% (almost 0.3 billion tonne-kilometres),
- secondary raw materials, municipal waste – 1.6% (over 0.2 billion tonne-kilometres),
- other goods – 1.1% (almost 0.2 billion tonne-kilometres),
- wood, wood and cork products, straw, paper and paper products, printing products and recordings – 1% (almost 0.2 billion tonne-kilometres).
Key changes in groups
In the second quarter of 2026, compared to the second quarter of 2025, several significant changes occurred:
- The largest increase in mass (to almost 15.3 million tonnes from 14.1 million tonnes) was recorded in the transport of the hard coal, lignite, crude oil, and natural gas group. By mass, the share of this group increased to 27.4% from 26.8% a year earlier (the highest share). In terms of transport performance, it is the group with the third highest share (15.5% compared to 15.6% a year earlier).
- The largest decrease in mass (to almost 14.9 million tonnes from 15.4 million tonnes a year earlier) was recorded in the group of metal ores and other mining products, which primarily includes aggregates used in construction. At the same time, it remained the second most important commodity group by mass in the transport structure (almost 26.7%) and the largest in transport performance (26.8%).
- A significant increase in transported mass was also recorded in the group of unidentifiable goods, primarily including intermodal units (to over 6.5 million tonnes compared to 5.4 million tonnes a year earlier). As a result, the share of this group in the transport structure increased to almost 11.7% from less than 10.3% a year earlier (in transport performance, this was an increase in share to over 14.8% compared to 13.2% a year earlier).
- In the second quarter of 2026, a nearly two-fold increase in transport was recorded in the group of products of agriculture, hunting, forestry, and fishing – to nearly 1.5 million tonnes compared to 0.9 million tonnes in the second quarter of 2025.
Directions of goods transport
In the second quarter of 2026, domestic transport dominated in terms of mass, accounting for 65% of the market. Imports accounted for 18.5% of the transported mass, exports for 12.8%, and transit for 3.7%.
In transport performance, domestic transport accounted for 55.5% of the transport work performed, imports for 21.9%, exports for 14.4%, and transit for 8.1%.
In the structure of international transport, unidentifiable goods, primarily intermodal units, dominated. In exports, they accounted for 26.2% of the transported mass and 27% of transport performance, in imports for 23.8% of mass and 25.1% of performance, and in transit for 30.1% and 29.8% respectively.
The transport of coke, refined petroleum products, and gases produced by industrial methods also played a significant role in all directions. Their share amounted to 23.1% of export mass and 25.6% of transport performance, 13.4% of import mass and 17.8% of transport performance, and 18.9% of transit mass and 17.2% of transport performance.
In imports, metal ores and other mining and quarrying products also played a significant role, with a share of 17.1% of transported mass and 16.5% of transport performance. In transit, metals and metal products had a significant share, accounting for 16.9% of mass and 16.4% of transport performance. In exports, the transport of coal, oil, and gas ranked third in terms of mass (15.9%), while chemicals and chemical products ranked third in terms of transport performance (11.4%).
The growth in transport in the second quarter of 2026 was primarily supported by an increased volume of energy raw material transport, the further development of intermodal transport, and a clear increase in the transport of agricultural products. Despite the decline in the transport of aggregates and mining products, this group remained one of the foundations of rail freight transport in Poland. The structure of international transport was dominated by unidentifiable goods and industrial and energy products, which confirms the importance of rail both in modern logistics chains and in serving traditional sectors of the economy.
Detailed information along with the full range of statistics is available on the Rail Data website in the Freight transport tab, Commodity groups.
Source: Office of Rail Transport