









In business practice related to process design, the “do it yourself” approach is popular. Based on the broader or narrower experience of employees, solutions are designed whose fit to reality is verified by life itself.
The reasons for this situation may be that:
a) Companies have limited capabilities, e.g., to copy/apply best practices in a new operation. They do not have access to theoretical models that would allow designing new processes in a way that provides the maximum effect at the minimum cost.
b) Companies for which opening new warehouses or light production is a daily routine (e.g., 3PL operators) prefer using benchmarks from similar operations, accepting far-reaching simplifications of such a way of working. Statistical models describing, for example, the relationship between one selected product feature and the obtained result are rarely used. Process design in these conditions is based on manually filling in key parameters (such as efficiency) based on experience. The weakness of such an approach is clearly revealed in the case of implementing new technical or organizational solutions not previously used in a given organization, as well as variability in product characteristics.
This can be summarized as replacing a methodical approach with an intuitive one, where decisions regarding investments or employment are made under conditions of very limited access to information. This leads to:
- underestimation or overestimation of investments,
- mismatch of employment to actual needs,
- unexpectedly long return on investment period,
- often completely misguided investments and getting entangled in multi-year contracts, e.g., in automation, generating losses instead of profits.
Efficiency experiments
The purpose of this article is to shed light on variables that are worth paying attention to when designing processes.
An experimental approach was used – an experiment was conducted consisting of simulating a typical picking and put-away process present in many production and warehouse operations. The study explored the relationships between various variables and efficiency. Numerical conclusions were then translated into practical business suggestions.
Assumptions and course of the experiment
As part of the experiment, answers were sought to questions about:
- differences in individual employee efficiency,
- impact of product characteristics on efficiency,
- impact of storage area organization on efficiency,
- differences in efficiency between processes,
- decision-making in conditions of low process formalization (lack of standards, lack of IT system support).
The study was conducted in a supermarket offering a wide range of food, chemical, toy products, etc. The similarity of typical storage areas in production and in the warehouse to supermarket shelves is illustrated by Figures 1-3:
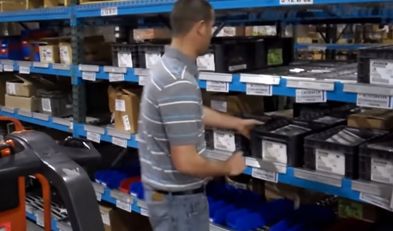
Figure 1. Example of storage in a warehouse
Source: https://www.youtube.com/watch?v=Y99UjmwaGAM
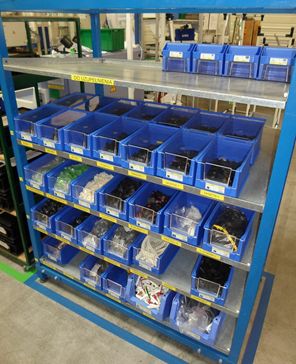
Figure 2. Example of a material facade in the production area
Source: http://www.egospodarka.pl/art/galeria/102131,Zamowienie-Karty-Kanban,4,20,2.html
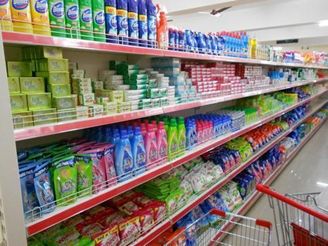
Figure 3. Example of “storage” in a supermarket
Source: https://www.indiamart.com/proddetail/supermarket-racks-10592455848.html
The team consisted of 4 people (three women and one man) of the same age and identical education1. Additionally, all participants in the experiment were previously unfamiliar with the topography of the supermarket (it was their first time there) and did not have practical experience in picking or putting away goods.
The task of each person participating in the study was to perform 10 picking cases and 10 put-away cases, each time in a different store aisle. As is easy to calculate, the study was conducted in 20 different aisles – two examples are illustrated by Figures 4 and 5.
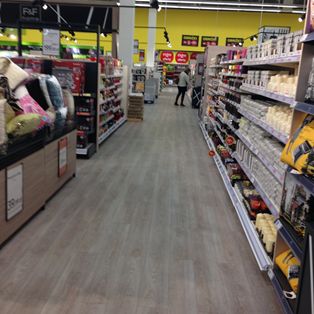
Figure 4. Example aisle where the experiment was conducted
Source: own study
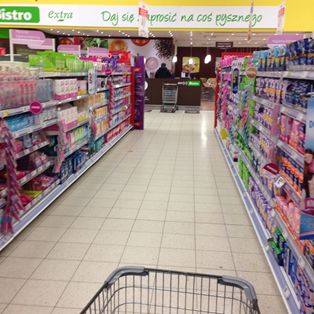
Figure 5. Example aisle where the experiment was conducted
Source: own study
The experiment assumed picking and putting away 20 different products selected by drawing (each in the quantity of 1 piece) with each passage through the aisle. The operating scheme (identical for the picking and put-away process), as well as the scope of measurements taken, is presented in Figure 6.
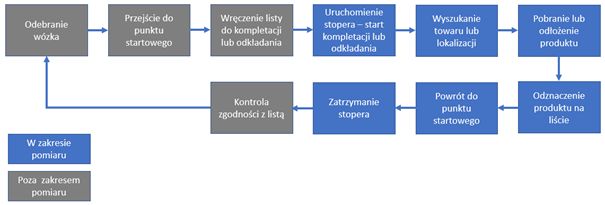
Figure 6. Picking and put-away process
Source: own study
The people participating in the study received lists of products to be picked and/or put away before each passage. Their task was to find the correct location and then mark the completion of the activity on the list. An example of a picking list is presented in Table 1.
| 1 | Nestle 8-grain porridge healthy tummy 250 g |
| 2 | Nestle Gerber apple and blueberry cream dessert 125 g |
| 3 | Bambino soap 90 g |
| 4 | Johnson’s baby chamomile shampoo 200 ml |
| 5 | Nivea Baby nourishing bath liquid 500 ml |
| 6 | Bebi soap flakes 200 g |
| 7 | BoboVita rice porridge 170 g |
| 8 | Nestle nan pro3 powdered follow-on milk 800 g |
| 9 | Nestle apple-cherry milk-rice porridge 230 g |
| 10 | BoboVita melissa and apple flavored tea 400 g |
| 11 | Bella Happy green tea extract diapers 42 pcs. |
| 12 | baby Comfort midi diapers 64 pcs. |
| 13 | Cleanic Kindii baby cotton buds 56 pcs. |
| 14 | Hipp first eco-grain crisps 30 g |
| 15 | Nestle nan pro1 powdered infant formula 2×400 g |
| 16 | Hipp Comfort Combiotic milk 350 g |
| 17 | Nestle Gerber DoReMi apple pie dessert 250 g |
| 18 | Bobofrut 100% apple, grape, chokeberry and raspberry juice 300 ml |
| 19 | Nivea baby soft&cream wipes 63 pcs. |
| 20 | Bornys air dry diapers 36 pcs. |
Table 1. Example of a picking list – children’s products
Source: own study
An important assumption was that the participants in the experiment were not guided through subsequent locations in any way, neither by the system, nor by instructions/standards, nor by the put-away/picking lists themselves, because the order of products appearing on them was random. This means that they had freedom in the sequence of picking and putting away – each of them performed the task as best they could. The difference in the (chaotic path used in the experiment) and the ordered path is presented in Figure 7. The experiment adopted such assumptions because, contrary to appearances, despite the prevalence of MES and WMS systems automatically calculating various types of ordered paths, the use of chaotic paths is still widespread.
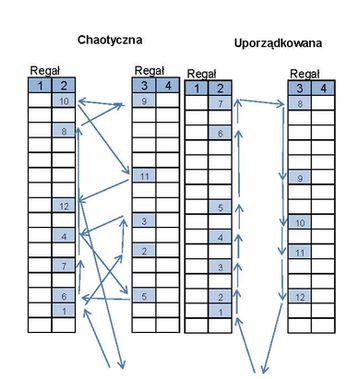
Figure 7. Examples of a chaotic and ordered path
Source: own study
Another assumption concerned financial motivation. The experiment adopted a very commonly used hourly rate. Therefore, there was no additional motivator to increase efficiency.
Analysis of experiment results
Comparison of picking times per Person
The analysis begins with a comparison of average picking times. The times for picking individual “picking lists” were averaged for each person participating in the experiment. The results are presented in Figure 8.
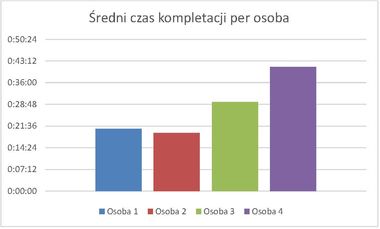
Figure 8. Average picking time per person
Source: own study
Persons 1 and 2 had very similar results – around 20 minutes per list (as a reminder, each list contained 20 unique products). Person 3 picked half as slowly, and Person 4 more than twice as slowly as the first two.
After analyzing the picking times, it is worth looking at the stability of the results, measured by the standard deviation from the mean (Figure 9).
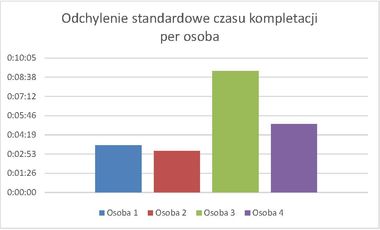
Figure 9. Standard deviation of picking time per person
Source: own study
It turns out that the results of Persons 1 and 2 were characterized not only by a low average (and thus good efficiency) but also by high stability. In their case, the standard deviation was at the level of about 3 minutes, which means that 2/3 of the results were within the range of average +/- 3 minutes. Meanwhile, the results of Persons 3 and 4 were characterized by much greater variability. The high standard deviation of Person 3 is particularly noteworthy, especially since their average picking time was significantly lower, and at the same time the standard deviation was significantly higher than that of Person 4. This means that their results were very unstable – some picking times were comparable to Persons 1 and 2, some to Person 4.
And indeed, comparing the average picking times of Person 1 and 3, it can be noticed that for Person 3, the first three passages with exactly the same picking lists took almost twice as long as for Person 1, but the difference between the next three was significantly lower (Figure 10).
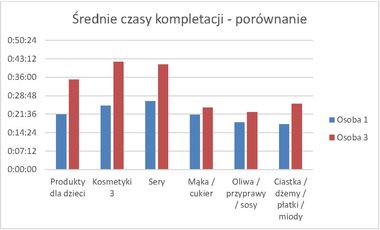
Figure 10. Comparison of average picking times of Person 1 and 3
Source: own study
The results of the experiment in the scope of picking can be interpreted as follows:
– In the case of poorly standardized processes not supported by systems or equipment, results depend to a large extent on personal predispositions. In these conditions, some employees will cope, others will not. System efficiency is conditioned and limited by “individual traits”.
– The more we rely on the perceptiveness and perception of employees, the greater the spread of results will be. This means that the current composition of operational employees will have a significant impact on the results obtained. In these conditions, the variability of average efficiency (especially in small teams where the laws of statistics will not necessarily work) can significantly disrupt the implementation of the production plan. Let’s look at the results of Persons 1 and 2 compared to Persons 3 and 4. We can perform the assigned work in x hours, but just as well in 2x hours, which can lead to delays and other process disturbances.
Comparison of put-away times per Person
After analyzing the picking times, the question arises whether the results of the reverse process, i.e., putting away, will be similar. How, then, did the efficiency and stability characteristics of the individual experiment participants turn out?
As in the case of picking, the average put-away times for each person participating in the experiment were compared. And indeed, the efficiency of Persons 3 and 4 again significantly deviated from the efficiency of Persons 1 and 2 – they needed approximately twice as much time to complete the same tasks. The results are presented in Figure 11.
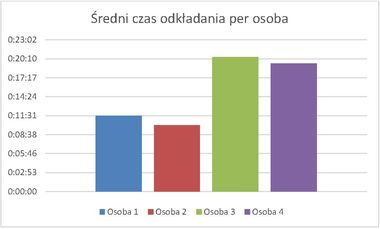
Figure 11. Average put-away time per person
Source: own study
Let’s also look at the stability of the process, which is presented in Figure 12. It turns out that in the case of putting away, the variability of the results of Persons 3 and 4 was even higher than in the case of picking. While 2/3 of the results of Persons 1 and 2 were within +/- 1.5 minutes of the average, in the case of Person 3 it was +/- 7 minutes, and for Person 4 +/- 10 minutes, which is about 4 and 6 (!) times more, respectively, than in the case of the first two.
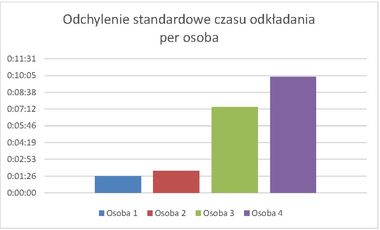
Figure 12. Standard deviation of put-away time per person
Source: own study
Thus, the characteristics of efficiency and stability of the results of individual experiment participants repeat in both processes.
The conclusions from the analysis are similar to those in the case of picking – efficiency is strongly dependent on personal predispositions, and the spread of results is significant, which can negatively affect, e.g., the accuracy/effectiveness of work planning.
Comparison of picking and put-away times
After analyzing the efficiency of picking and putting away, it is worth comparing these two processes. The results are presented in Figure 13.
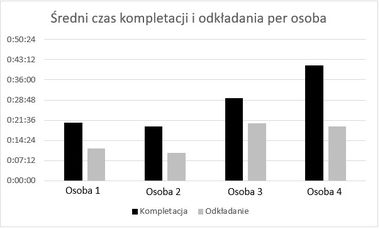
Figure 13. Average picking and put-away time per person
Source: own study
The first observation concerns the efficiency of both processes. It turns out that the put-away process is twice as fast as the picking process. This coincides with observations from warehouses where a manual picking process takes place. The most adequate analogy is picking from a so-called mezzanine, i.e., small shelves.
In warehouses of this type, the picking process can consume well over 50% of all man-hours worked by operational employees.
The question arises, what is the reason for such a large difference in the time of the picking and put-away process? The question is all the more justified because the length of the aisles (and therefore the distance to be traveled), the number of approaches to locations, and the number of pieces in both cases were identical. The answer may lie in the following observations:
- During picking, the experiment participant saw a description of the product on a piece of paper, which they then had to search for on the shelf and visually confirm its compliance with the contents of the picking list. This required attentiveness, and the occurrence of a number of similar products next to each other (e.g., products of the same brand differing in the number of pieces or volume) additionally made it difficult to find the correct item.
- During putting away, the situation was much simplified because the participant could search for the correct location by following the appearance of the product. Thus, they were guided “visually” – in addition to descriptive information, they had colors and shapes, and more generally – an image of the item being put away. As MIT studies have shown, the human brain needs 13 milliseconds to recognize an image2. It goes without saying that understanding written text is definitely slower. Therefore, having an “image” of the product, they could identify from a distance the likely locations they were to visit.
- Additionally, during putting away, the participant saw all the products in the basket. This means that they could much more easily “organize” the list – that is, instead of putting away products from the list one by one, they could rather search for products from the basket as they traversed the aisle, thus minimizing the distance traveled.
The second observation concerns the correlation between picking and put-away times. In this case, the result is 0.84.
A correlation at this level means a very high dependency, taking into account the ranges:
– Below 0.2 – no relationship,
– 0.2 to 0.4 – low correlation,
– 0.4 to 0.6 – moderate correlation,
– 0.6 to 0.8 – high correlation,
– 0.8 to 0.9 – very high correlation,
– Above 0.9 – full correlation.
This means that if it took a given person more time to pick, they most likely also needed more time to put away. This is proof that the differences in individual efficiency were universal – the consequences repeated in both processes.
Dependence of efficiency on assortment and/or storage zone organization
The next hypothesis that the study was to verify was: there is a relationship between the assortment and/or the organization of storage zones and efficiency. Some products are easier to find, some aisles could have been organized in a more intuitive way, conducive to product identification.
Figure 15 presents the average picking time from individual aisles:
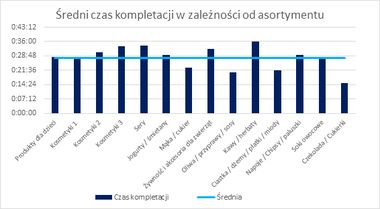
Figure 15. Average picking time depending on the assortment
Source: own study
As is easy to notice, the results fluctuated quite strongly – the difference between the longest and shortest picking time was almost twofold, and deviations from the average ranged from -45% to +29%.
Next, the efficiency in the put-away process was verified (Figure 16).
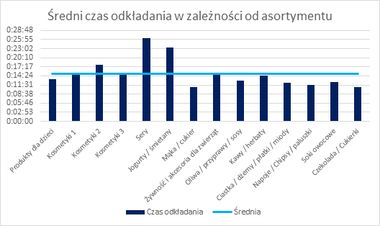
Figure 16. Average put-away time depending on the assortment
Source: own study
Again, the results differed significantly from each other, deviating from -28% to +74% from the average.
We therefore know that the results of picking and putting away differed depending on the aisle/assortment. In order to verify the hypothesis that this variability is not accidental, Figure 17 compares the times of both operations.
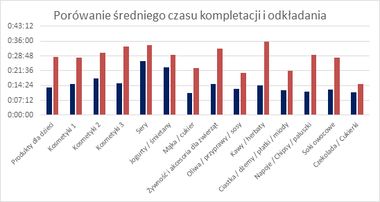
Figure 17. Comparison of average picking and put-away time depending on the assortment
Source: own study
Since we are interested in process variability, for ease of comparison, the results were normalized by adopting the minimum picking and put-away time as 100%. The results are presented in Figure 18.
Figure 18. Comparison of average picking and put-away time depending on the assortment
Source: own study
At first glance, it can be seen that there was a certain relationship between picking and put-away times depending on the aisle. And indeed, the correlation coefficient in this case is 0.53, which means a moderate relationship.
Thus, we can assume that the differences in picking and put-away times depending on the aisle are not accidental – they are consistently higher or lower. This confirms the hypothesis that the assortment and organization of the storage zone has a significant impact on process efficiency.
Decision-making regarding the sequence of picking and putting away
As mentioned earlier, the experiment participants independently made decisions regarding the sequence of picking and putting away products.
Nevertheless, given that everyone started from the same point, one would expect that the paths of passage of individual pairs would be similar.
The results for one example aisle are presented in Figure 19.
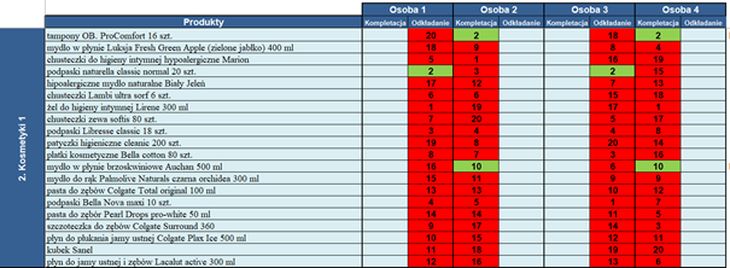
Figure 19. Consistency of picking and put-away paths
Source: own study
Each path was traversed four times – two pickings and two put-aways. The numbers in the columns indicate the order of approaching the locations. For example, Person 2 during picking approached the location with intimate hygiene wipes first, and Person 4 visited the location with intimate hygiene gel first. Since there was no consistency in the order of approach, both of these approaches were marked in red. Where such consistency existed, they were marked in green.
At first glance, it can be seen that the hypothesis that the paths would overlap was wrong. The consistency of picking and put-away paths is 7.5% and 5%, respectively, which is presented in Figures 20 and 21.
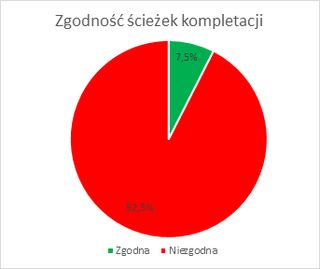
Figure 20. Percentage of consistent and inconsistent approaches to locations
Source: own study
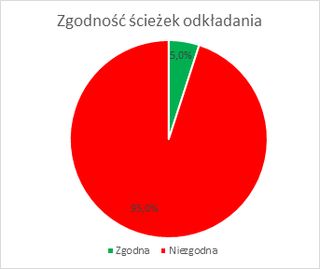
Figure 21. Percentage of consistent and inconsistent approaches to locations
Source: own study
From the above analysis, it can be concluded that a process characterized by low “equipment” (lack of standards, decisions made autonomously by the person performing the process) will be characterized by high variability. One person will choose a path close to optimal, another – quite the opposite.
This is confirmed by observations from real processes – in the case of poor control of compliance with standards, local “optimization” performed by employees appears. It is worth noting that the mentioned individual “optimization” can be done in good faith, but it is based on intuition, not best practices. Bypassing standards gradually leads to differentiation of individual productivity, instability of process quality, and as a result, to a gradual decline in overall process efficiency.
Practical conclusions
The study was conducted on a small scale, nevertheless, based on the results of the data analysis, a number of practical conclusions can be drawn.
| Conclusions from the analysis | Practical conclusions |
| In the case of poorly standardized processes not supported by systems or equipment, results depend to a large extent on personal predispositions. In these conditions, some employees will cope, others will not. System efficiency is conditioned and limited by “individual traits”. | – It is crucial to analyze the efficiency of individual employees and focus on exceptions – employees with exceptionally high and low productivity. It is worth observing what excellent results stem from – this is the basis for building an efficient process. – Raising average efficiency, e.g., by implementing an incentive system promoting work efficiency, can allow moving the least efficient employees to tasks for which they have better predispositions. This will lead to a further increase in average efficiency. – Process standardization makes results independent of individual traits and allows replacing “tribal knowledge” with the best collective knowledge. Moreover, innovations and improvements made by individual employees have a chance to improve the standard for the benefit of the total efficiency of the process/organization. – Implementing a system that forces picking consistent with the shortest path will cause differences in average efficiency to decrease. The system becomes a “guardian of the standard”. – It is worth adjusting the recruitment process to verify predispositions for performing planned tasks. Focusing on the rate can be counterproductive – what is the point of “saving” 10% on salary if productivity differences reach 100%. This recommendation is all the more important the less standardized the process is. |
| The more we rely on the perceptiveness and perception of employees, the greater the spread of results will be. This means that the current composition of operational employees will have a significant impact on the results obtained. | – Simplifying the process reduces result variance, facilitates planning, and reduces the dependence of efficiency on individual predispositions. Here the power of automation is revealed – for example, eliminating walking through automatic transport (so-called goods to men) makes it impossible for employees to “create” transport paths. |
| The put-away process is twice as fast as the picking process. | – Visualization of the picked product can significantly affect the efficiency (as well as the quality) of the process. The less IT system support, the more we rely on the senses of employees and the greater the beneficial impact on efficiency can be. – Storing similar products next to each other should be limited. Thanks to this, we limit the risk of errors and increase process efficiency through easier searching. The gain appears regardless of whether the employee is guided by the system or not, but the less IT system support, the greater the benefit. |
| Assortment and storage zone organization has a significant impact on process efficiency. | – Efficiency will be different for different products. When calculating productivity, putting large, small, regularly shaped, and oversized products “into one bag” can lead to unpredictable results. This, in turn, will make planning difficult because efficiency will constantly change depending on the assortment mix. The mismatch of resources to actual needs appearing in this situation means significant financial losses – downtime or employee overtime, temporary excess or shortage of equipment, unstable service for customers. – Organization of zones, visual markings (e.g., using colors), and applying rules regarding the mutual location of products can additionally improve productivity. |
Source: own study
What next?
The experiment had a limited scope, and research can go much further, from increasing the sample to verifying subsequent hypotheses. For example, interesting conclusions could be drawn from:
- comparing different types of picking,
- analyzing the learning curve,
- comparing efficiency depending on gender, age, etc.,
- verifying the impact of financial motivation on quality and efficiency results.
Designing processes means confronting a multitude of factors, making decisions regarding IT technology and equipment under conditions of uncertainty and incomplete information. Although the study does not exhaust the topic, its main task was to inspire readers to think about the organization of their own processes and to indicate how this task can be approached analytically.
Full version of the article published in Logistyka magazine 2/2020.
E-edition of the magazine is now on sale!

1. In the further part of the article, the experiment participants were called Persons 1, 2, 3, and 4.
2. http://news.mit.edu/2014/in-the-blink-of-an-eye-0116